Current Issue
Our Partners
P3 1-2/2025 en
What Does it Mean ...
Jupyter Notebook
Education Gap
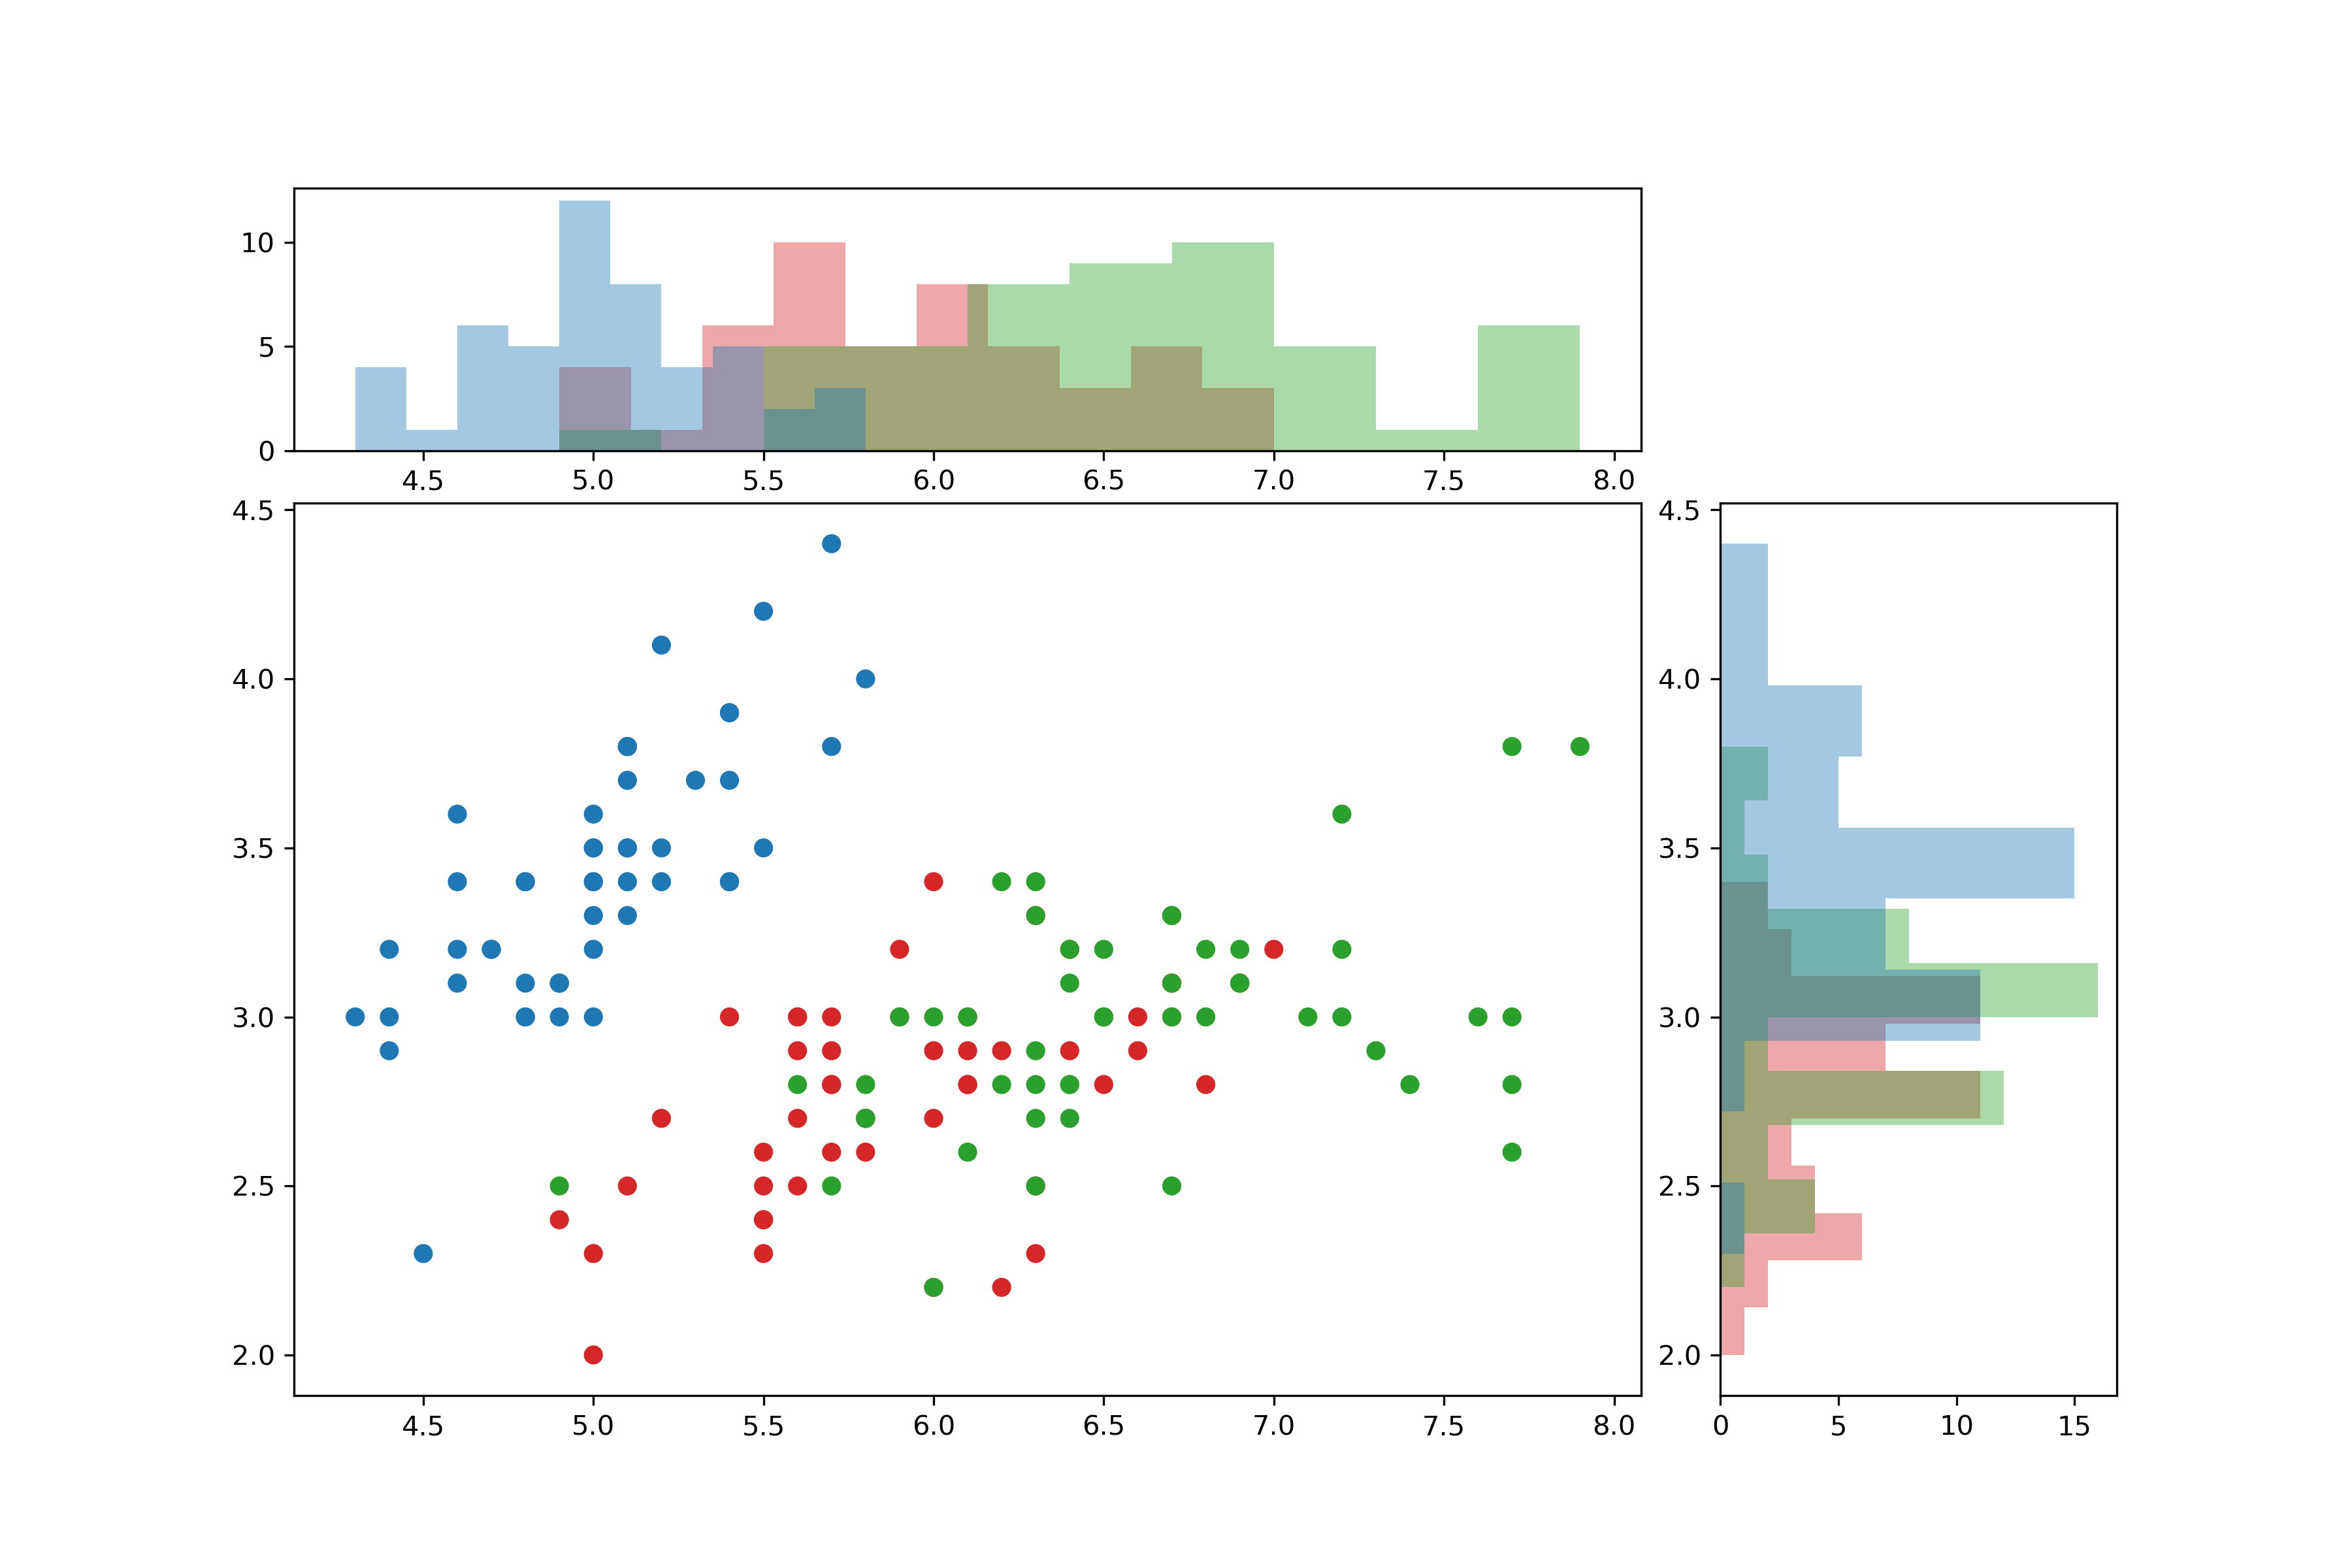
A scatter plot with two histograms as output from a Jupyter notebook.

Jupyter Notebooks aren't the kind of thing you buy at your local computer store and pay for with cash. Rather, we're in the realm of big data. Jupyter Notebooks is a software application primarily used for analyzing and visualizing large amounts of data – preferably live and in real time. But the files with the somewhat cumbersome file abbreviation ipynb can also be easily saved and shared.
A scatter plot with two histograms as output from a Jupyter notebook.
Qu'est-ce que c'est?
From the official description: “A notebook is a shareable document that combines computer code, plain language descriptions, data, rich visualizations like 3D models, charts, graphs and figures, and interactive controls. A notebook, along with an editor (like JupyterLab), provides a fast interactive environment for prototyping and explaining code, exploring and visualizing data, and sharing ideas with others.”
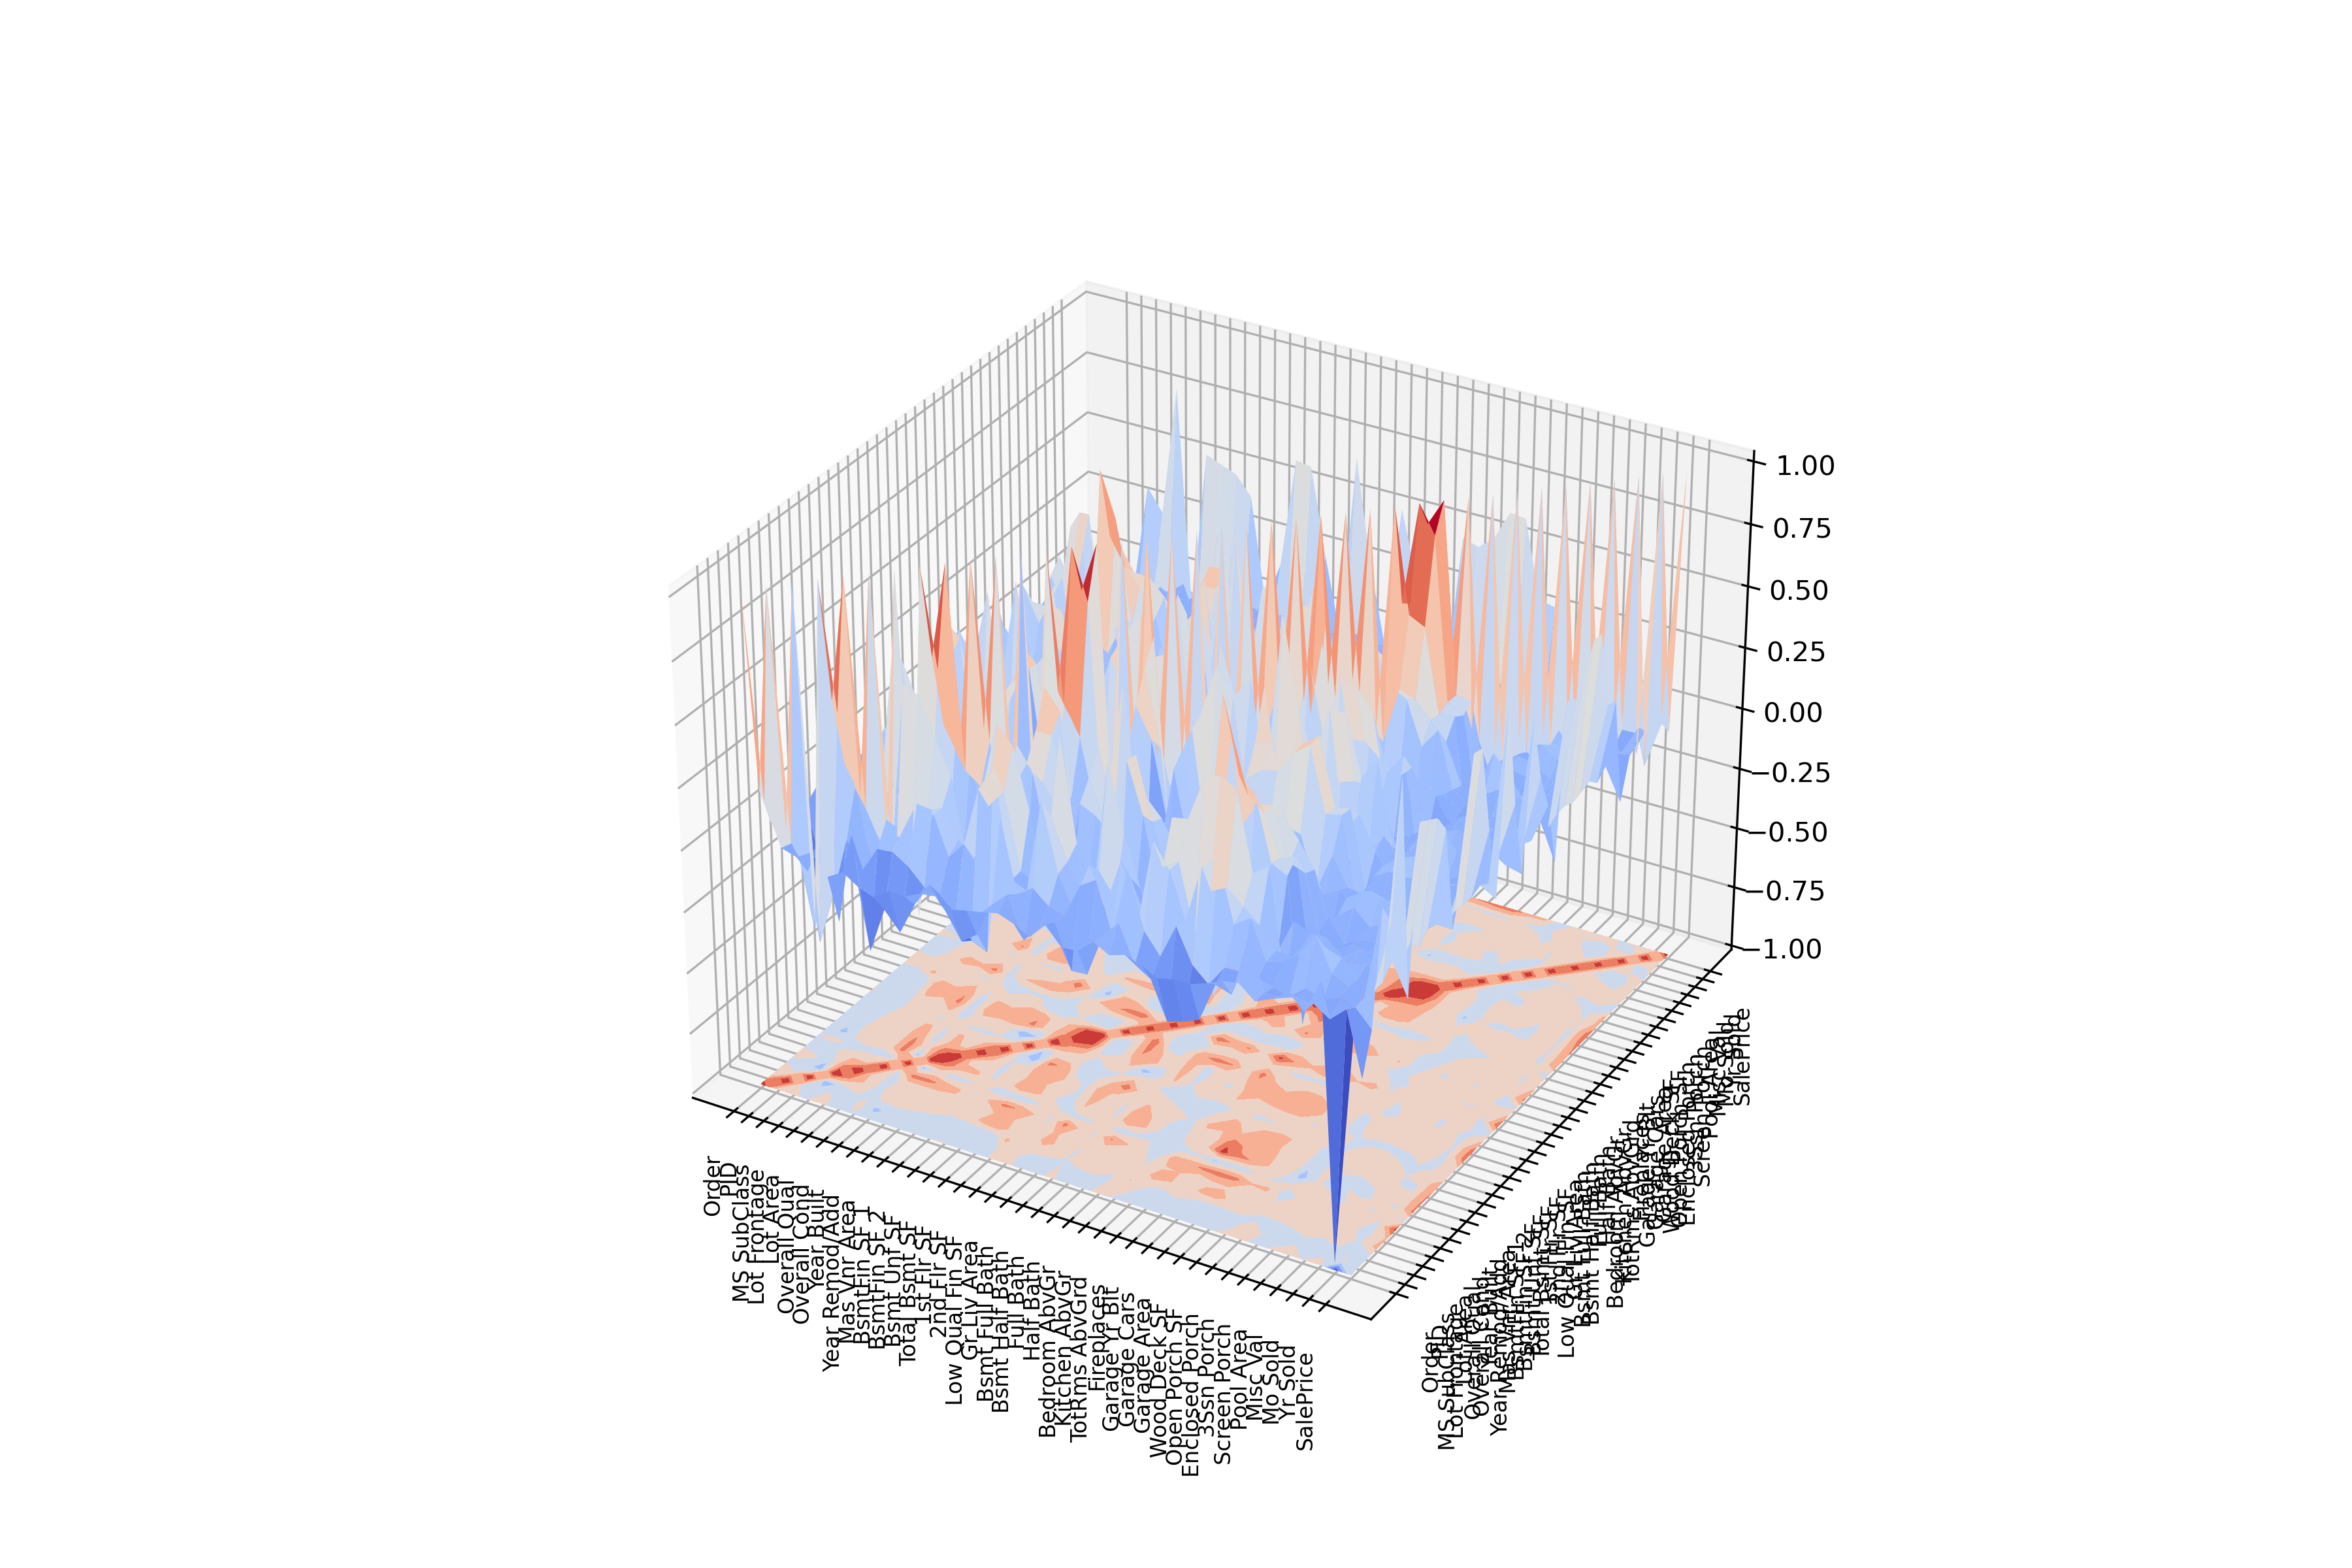
Jupyter Notebooks essentially consist of any combination of code cells and markup cells. While the latter are intended for textual descriptions and explanations, code cells are used for script-like programming. The code can be executed and modified – isolated for each cell – and immediately delivers results, such as visual representations of the data. In addition to classic bar charts and pie charts, more sophisticated visualizations such as box plots, scatter plots, matrices, and even 3D plots are available. What all graphics have in common is that they can be configured in a wide variety of ways, making Jupyter Notebooks ideal for presentations, workshops, or video conferences.
Work environment
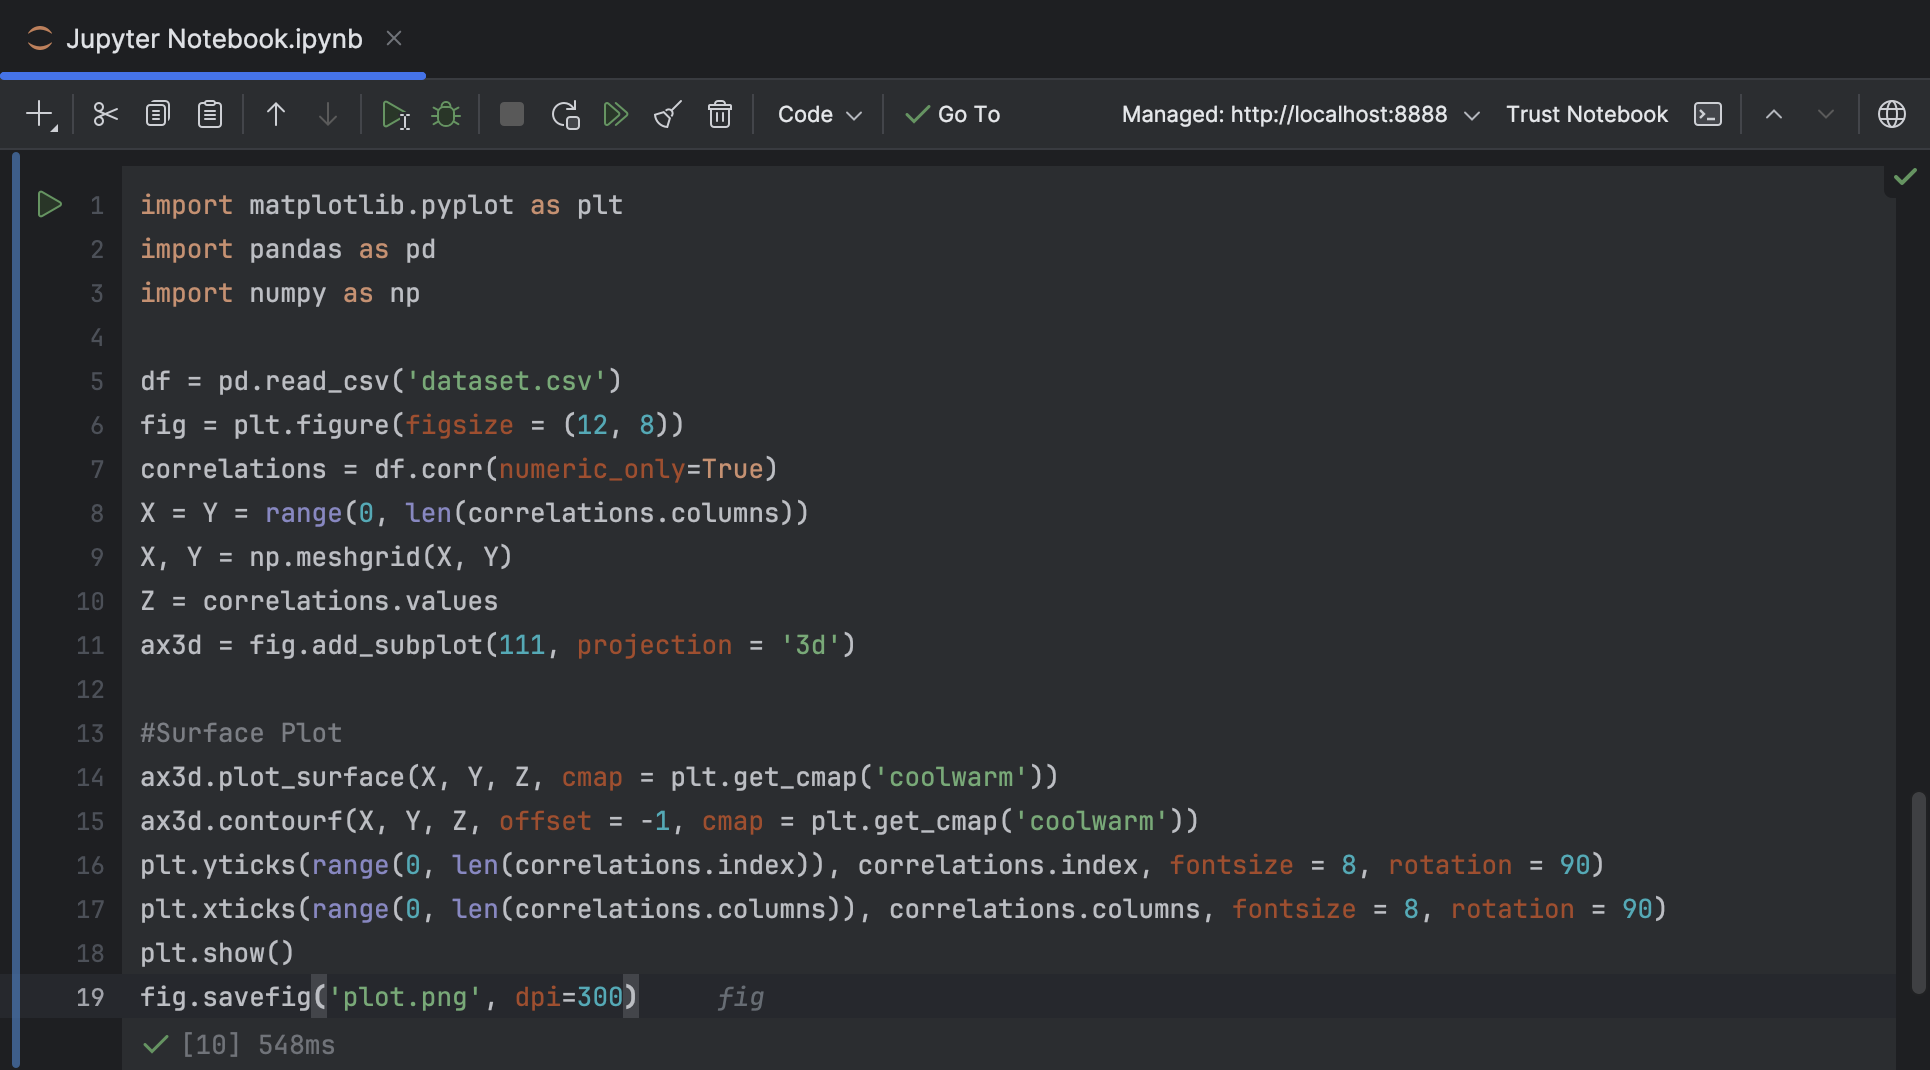
The easiest way to create and run a Jupyter Notebook is to use the web interface JupyterLab in your browser. Seriously interested parties will prefer a local installation and consult the extensive documentation. Ultimately, you'll unlock its full potential with maximum control: As part of an integrated development environment (IDE) such as JetBrains DataSpell or PyCharm, which include native Jupyter support, the system is equipped for all professional use cases.
Jupyter Notebooks can be used with various programming languages. The first step is to load a language core, a so-called kernel. While there are language cores for many common languages, such as Java, PHP, or Dart, these are considered rather exotic when it comes to data analysis and processing. In 99 percent of cases, you will use Python, the standard language for these types of applications – possibly supplemented by R, a scripting language particularly suited to statistical applications. The great advantage of Python – in addition to the uncomplicated setup of a suitable working environment – is the availability of a large number of libraries that were created precisely for these problems and have been tried and tested over many years. The classic libraries are called pandas, numpy, seaborn, and, of course, matplotlib. They are all available free of charge, either separately or – more conveniently – as part of a ready-made Python distribution such as Anaconda.
Of course, every programming language initially has a more or less steep learning curve. Python is no exception. However, you will rarely need to delve into the depths of its programming constructs (i.e. fluent Python); data preparation and graphical representation can often be achieved with just a few lines of code. At the end of this article, you will find further literature references that should get you fairly well-versed.
It doesn't matter what type of data you're dealing with. Sales or other financial data, market analyses, or log or maintenance data from a production plant - anything is possible. Depending on the quality of the data, some prior processing may be necessary, but the Python libraries - especially pandas and seaborn - offer all the necessary tools for this. This includes handling file formats that are “logical” choices for data processing: CSV and XLSX files can be loaded with a single line of code, and direct access to an SQL database (even remotely) is also possible. Ultimately, in an IDE, the entire scope of Python is available beyond the libraries mentioned.
Further reading
Landup, D.: Data Visualization in Python with Matplotlib and Pandas (StackAbuse)
Vanderplas, J.: Python Data Science Handbook (O'Reilly)
McKinney, W.: Python for Data Analysis (O'Reilly)